Orkla stock (Oslo): support at 96 kroner became resistance
A price area that stopped five falls, and then stopped a rise.
Every figure below was measured on September 21, 2026 and has not been updated since.
Orkla has been falling since the summer, from around 107 kroner in July to
around 90 now.
You may have seen someone say there is "support at 96". Does that mean
anything, or did somebody draw a line where the price happened to turn?
The short version: 96 kroner held Orkla up five times in two years. In
August it gave way, and now it is the ceiling instead. Below the price, the
weekly chart has nothing left.
The rest of this post is the evidence for those three sentences. Every price is
a weekly close, which is where Orkla ended the week on a Friday.
First: what support is
A price where buyers have turned up before and stopped a fall. Resistance is
the same thing upside down: a price where sellers have turned up and stopped a
rise.
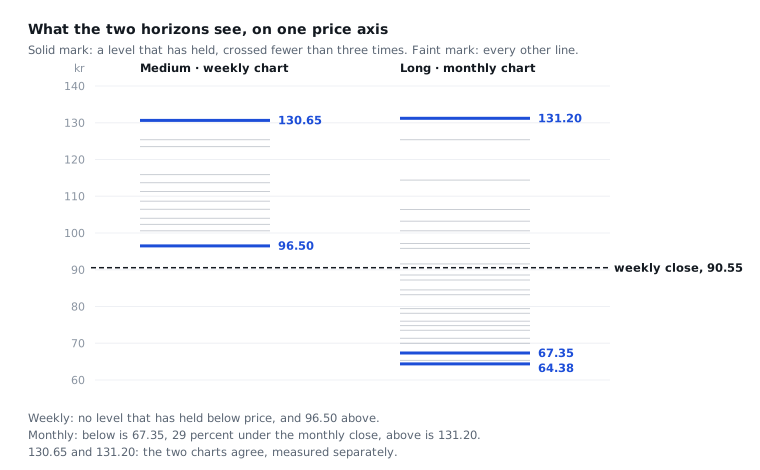
The weekly chart looks back two years. On it there are twelve prices you could
draw a line at, and price has turned at every one of them at some point.
But price has gone straight back through eight of those, between six and twelve
times each, so those eight are not boundaries at all. They are just places the
price has been.
The monthly chart looks back ten years. It finds twenty-three lines and trusts
three of them.
This is the part most people have backwards. More lines do not mean firmer
ground. Usually they mean price has moved through that area easily.
One price axis, two charts, measured separately.
Two things stand out. The weekly column is empty below the price. And both
charts put a level at the same height near the top, 130.65 and 131.20, worked
out separately from each other. Two charts agreeing is the strongest evidence a
level gets.
That leaves one area on the weekly chart worth the name. Around 96 kroner.
What made 96 matter
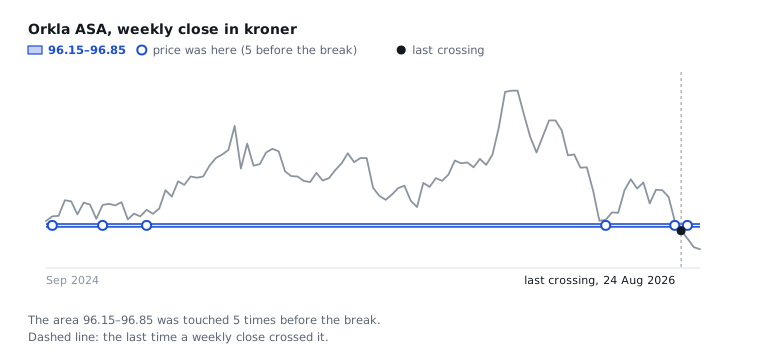
Five times in the two years before August, a fall reached 96 and the week still
closed above it.
Not roughly to it. In four of the five, the week's low stopped between 96.15 and
96.85. In the fifth, the week of 17 August, it dipped to 95.15 and still closed
above. Not one week in those two years closed below it.
Five times the fall reached this area. In August a week closed below it.
Now put the monthly chart beside it. Between 131.20 and 67.35 it has no level
that has held. So 96 is a two-year structure sitting inside a
ten-year gap.
Then, in August, it went below
In the week starting 17 August, Orkla opened at 103.30 and closed at 97.55, on
one and a half times the volume of a normal week.
The week after that, it closed at 95.20.
First time in two years a week had ended below 96.
And then the interesting part
The next week, price climbed back to 96.40. Straight back to the same area.
It got no further. That week closed at 93.25, and the two after it at 91.10 and
90.55.
The area that had stopped five falls was now stopping a rise.
And it matters who is standing there. Everyone who bought around 96 in those
two years is down on the trade. If price climbs back, that is where they
can sell and break even. So there are real people waiting at 96, with a reason.
That is what a level is made of.
Where price is now
The last weekly close is 90.55, well below the 96 area.
The weekly chart has nothing at all below the price. The monthly chart's last
settled close is August's, at 95.45, and it has fifteen zones below that. Price
has closed straight through twelve of them, between five and nineteen times
each, and one more has never been tested. The two that have held are 67.35 and
64.38, and both are a long way below where the price is now.
So the two charts do not disagree. One sees two years and the other sees ten,
and they say the same thing: the nearest price that has held is far away, up
or down.
What 96 is good for
96 tells you nothing about where price is going. It tells you where you would
notice if the picture changed.
Ten of the twelve lines on the weekly chart can be ignored. Of the two left, one
is 130.65, a long way up, and the other is 96. Knowing which ten is most of the
work.
And one thing would cancel the whole reading: a weekly close above 96.85. That
puts price back over the level. You would see it yourself, on a Friday, without
anyone telling you.
You may have noticed this post never says which way the price goes next. Here
is why. 1,350 breaks have been measured across the site's companies, and
whether the level held or not, the twelve weeks afterwards look the same as any random week.
Anyone who tells you different is guessing.
Corrected on 27 September 2026: an earlier version miscounted how often a
fall reached 96, and two counts of lines. The numbers above are the corrected
ones.
Analysis, not investment advice. Everything here reports what was measured. What to do about it is your decision.