AKVA group stock (Oslo): 139.25 kroner stopped price for 17 weeks, then held from above
A ceiling that stood for 17 weeks gave way in one, and neither chart has a line above price now.
Every figure below was measured on September 28, 2026 and has not been updated since.
AKVA group closed the week starting 31 August at 143.00 kroner. It was the
first weekly close above 140.00 since the stock was at that price in May.
Three weeks later the last weekly close is 141.50.
You may have heard someone say the stock "broke out above 140.00". Is that a
fact about the chart, or a line drawn where price happened to turn?
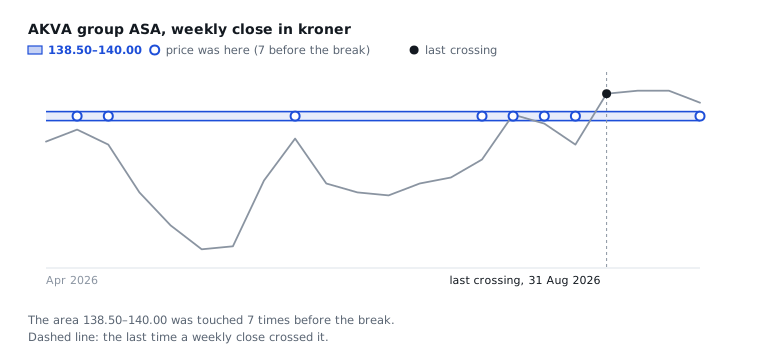
The area from 138.50 to 140.00 turned price back seven times between May and
August, and 16 weekly closes in a row stayed under it. On 31 August a weekly
close finally went above. On 21 September price came back down into the area,
and left it upward.
The rest of this post is the evidence for those three sentences. Every price
is a weekly close unless it says otherwise, which is where the stock ended the
week on a Friday. All figures are as of 28 September: the weekly chart's last
settled week is the one starting 21 September.
First: what resistance is
A price where sellers have turned up before and stopped a rise. Support is the
same thing upside down: a price where buyers have turned up and stopped a
fall. When a resistance gives way and price then stands above it, the same
line is a candidate for support. That is the idea this post follows, and
whether it happens every time is exactly the part that has not been shown.
The weekly chart looks back two years. On it there are 31 prices you could
draw a line at, and price has turned at every one of them at some point.
But 25 of the 31 can be ignored. Price has gone straight back through 18 of
them, between three and nine times each, five more are only clues, and two
have already switched sides. Six are left.
The monthly chart looks back ten years. It finds 33 lines and trusts three
of them. The other 30 can be ignored. Price has gone through 25 of them, between
three and 20 times each, and five are only clues.
More lines do not mean firmer ground. Usually they mean price has moved
through that area easily, again and again.
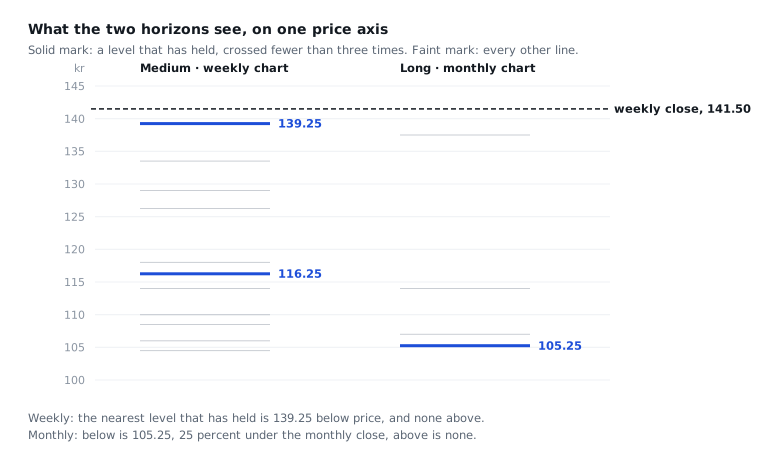
One price axis, two charts, measured separately.
The weekly chart's six trusted levels are all below the last close of 141.50:
139.25, 116.25, 98.40, 73.20, 59.10 and 54.80. Above price it has one line
left, 150.00, and that one is only a clue.
The monthly chart trusts three: 105.25, 46.50 and 41.30. Its latest bar is
September, which is not finished and stands at 140.00 so far, and the nearest
of the three is 105.25, 24.8% below that.
So the two charts do not agree on 139.25. The weekly chart trusts it. On the
monthly chart the nearest line there is 137.50, and it is only a clue.
Nothing here says which chart is right. They are measuring at different
speeds: the weekly chart has two years to judge a level against and the
monthly has ten, and a price that has stood only seventeen weeks is a short
history on the second.
What made 139.25 matter
The area is 138.50 to 140.00. Price reached it in seven separate weeks before
the break: the weeks starting 4 May, 11 May, 22 June, 3 August, 10 August,
17 August and 24 August.
The first, in the week starting 4 May, went up to 138.50, the bottom of the
area, and closed at 137.00. The last, in the week starting 24 August, went
up to 139.00 and closed at 134.50. Between the first of those and the break
there are 17 weeks, and none of their closes was above the area. Sixteen
were below it. One, the week starting 10 August at 139.50, was inside it.
Price reached the area seven times and never closed above it. Then it closed above, and came back once.
Then, on 31 August, it went through
The week starting 31 August opened at 135.00, went as high as 150.00 and
closed at 143.00. That is the crossing. The first weekly close above the
area.
Volume that week was 1.89 times the stock's own average over the trailing
year. Whether a break on heavier volume behaves differently afterwards has
not been measured here, so this post states the number and stops there.
And then the retest
The next two weeks did not come back. The week starting 7 September closed at
143.50 and its low was 141.50. The week starting 14 September closed at
143.50 as well, with a low of 143.00.
The week starting 21 September opened at 144.00 and went down to 137.00, below
the bottom of the area, and closed at 141.50, above its top. That is the
retest, the one time price has come back since the break.
It left the area upward, which is what a level that has held from the other
side looks like in the data. One week of evidence, not two years. Not a
confirmed change of role either.
Where price is now
The last weekly close is 141.50. The nearest level the weekly chart trusts is
139.25, 1.6% below. Under it come 116.25, 98.40, 73.20, 59.10 and 54.80. Above
price the weekly chart has only the clue at 150.00.
The monthly chart has no line above price at all, and its nearest trusted
level, 105.25, is 24.8% below that bar's 140.00 so far. September's month is
not settled, so what it closes at is not something anyone can say yet.
That is a distance worth being clear about. The weekly chart's closest level
is 1.6% away and the monthly chart's closest is 24.8% away, and both are
true. One looks at price over two years and one over ten.
What 139.25 is good for
139.25 tells you nothing about where price is going. It tells you where you
would notice if the picture changed.
25 of the 31 lines on the weekly chart can be ignored. Of the six that are
left, all are below price and one is 1.6% away. Knowing which is most of the
work.
One thing would cancel the whole reading: a weekly close below 138.50, the
bottom of the area. Then price is back under it, the way it spent the 17
weeks before. You would see that yourself, on a Friday, without anyone
telling you.
You may have noticed this post never says which way the price goes next. Here
is why. 1,350 breaks have been measured across the site's companies, and
whether the level held or not, the twelve weeks afterwards look the same as
any random week. Anyone who tells you different is guessing.