Veidekke stock: 197.60 kroner was broken upward, and price has not been back
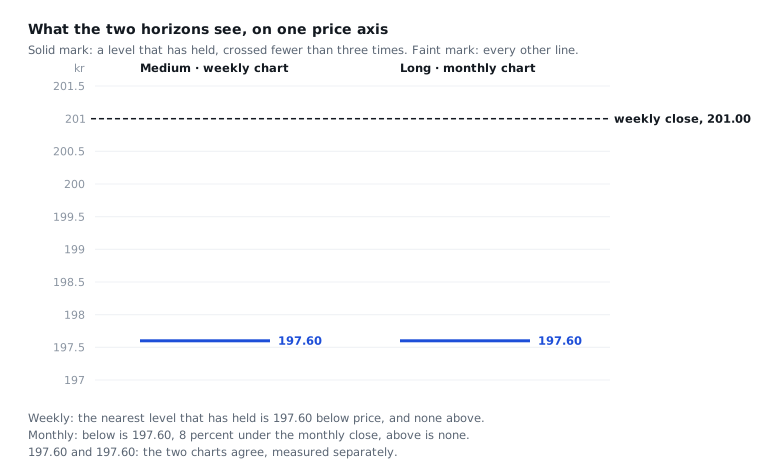
The nearest support is 1.7% under the price. Above the price there is no resistance that has held.
Every figure below was measured on October 12, 2026 and has not been updated since.
Veidekke closed the week of 5 October at 201.00 kroner. On 10 August the close went above 197.60 for the first time. Has 197.60 acted as support since then?
Support is a price where buyers came before and stopped a fall. Resistance is a price where sellers came before and stopped a rise.
The answer is that price has not come back down to 197.60. The level has not been tested as support.
Nearest support that held: 197.60 kroner, 1.7% under the weekly close. It is the same price on the weekly chart and the monthly chart.
Nearest resistance: none. No price above the close has held, on the weekly chart or on the monthly chart.
Every price is a weekly close, unless the text says "monthly".
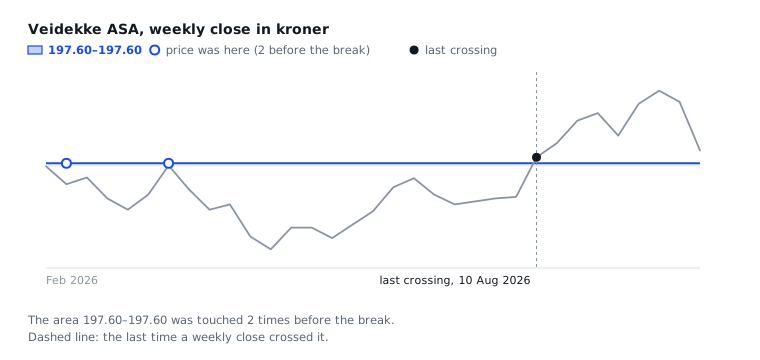
197.60 stopped price for 23 weeks, and was broken in the week of 10 August
Price reached the level in two weeks before the break. No week has reached it since.
Price first reached 197.60 in the week of 2 March 2026. It reached the level again in the week of 6 April. From the first week to the break, 23 weeks closed under the level and none closed over it.
In the week of 10 August, Veidekke closed at 199.20, over the level. Volume was 483,193 shares, which is 1.56 times a normal week.
Since the break, the weeks have closed at 203.00, 209.00, 211.00, 205.00, 213.50, 217.00, 214.00 and 201.00. The lowest price in a single week was 198.80, in the week of 5 October. Price never reached 197.60.
So the level has two touches before the break and none after. Two is a small number. No weekly close under 197.60 has been measured yet, so it is not known whether the level holds when price comes back.
Over the price: two lines, and neither has held
The weekly chart shows 2 lines over the price. One is 209.80, which price went through 4 times. The other is 214.50, which is a clue and not a level. Neither has held.
The monthly chart has no line over the monthly close of 215.00.
When price is over every level that has held, there is no price to measure resistance against. This post therefore gives no target over the price.
Under the price: the weekly and monthly charts agree on two levels
One price axis. Two charts. Each chart is measured on its own.
The weekly chart shows 22 lines and does not trust 18 of them. The monthly chart shows 31 lines and does not trust 27. The other four on each chart are levels that held.
Both charts trust 197.60. The weekly chart also trusts 171.20, and the monthly chart trusts 171.40. Each chart found these levels on its own. Two charts that agree is the strongest evidence a level can have.
The monthly chart puts 197.60 at 8.1% under the monthly close of 215.00. The monthly chart is measured to September 2026, and October is not finished.
One weekly close that would change this read
A weekly close under 197.60. Price would then be back under the level, and the break on 10 August would not have led to support.
It shows on the weekly chart at the end of a week.
Why this post gives no forecast
1,350 breaks have been measured across the site's companies. The 12 weeks after a break look like any 12 random weeks, whether the level held or not. The measurement gives no basis for a forecast.