Norwegian Air Shuttle stock: 12.35 kroner was broken downward, and no week has closed over 12.41 since
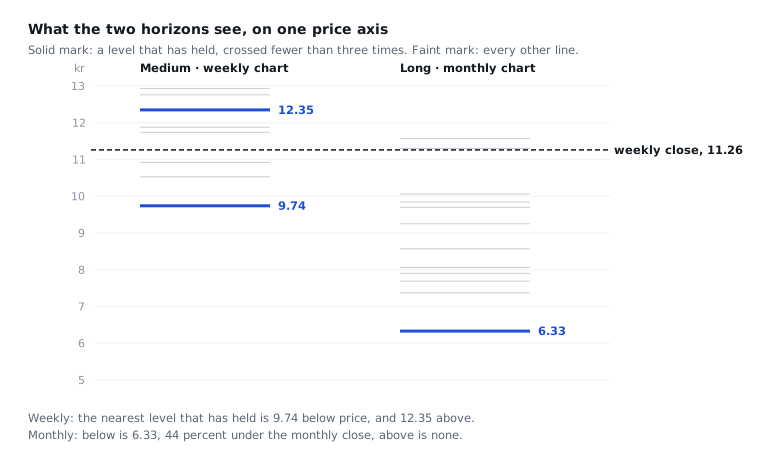
The nearest resistance is 12.35, 9.7% over the price. The nearest support that held is 9.74, 13.5% under.
Every figure below was measured on November 2, 2026 and has not been updated since.
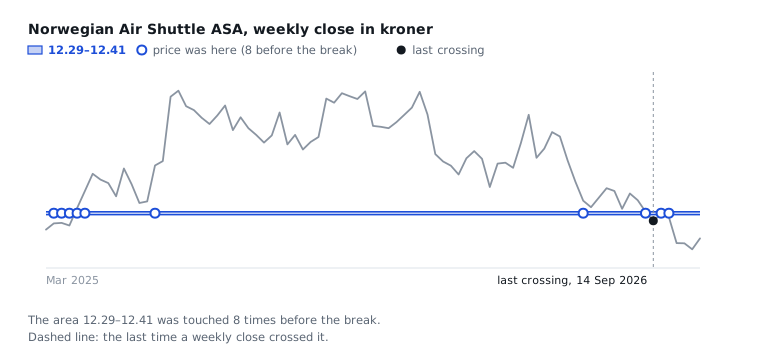
Norwegian Air Shuttle closed the week of 26 October at 11.26 kroner. In the week of 14 September the close went under 12.35, an area price had reached in eight weeks over a year and a half. Has 12.35 acted as resistance since then?
Support is a price where buyers came before and stopped a fall. Resistance is a price where sellers came before and stopped a rise.
The answer is that price came up to the area twice after the break and closed under 12.41 both weeks. Then price fell. No week since has closed over the area.
Nearest resistance that held: 12.35 kroner on the weekly chart, 9.7% over the weekly close. The monthly chart has no resistance that held.
Nearest support that held: 9.74 kroner on the weekly chart, 13.5% under the weekly close. The monthly chart has support at 6.33, 43.8% under the monthly close.
Every price is a weekly close, unless the text says "monthly".
12.35 was reached in eight weeks before the break and was broken in the week of 14 September
The area is 12.29 to 12.41. Price first reached it in the week of 24 March 2025 and reached it in eight weeks before the break. Five of those were in a row, from 24 March to 21 April 2025.
From the first touch to the break, 77 weeks passed. Of those, 74 closed over the area and 3 under. So the area was under the price most of the time. That measures how often price was above it, not how many times price turned there.
In the week of 14 September, Norwegian opened at 12.36 and closed at 12.02, under the area. Volume was 29,898,313 shares, which is 0.82 times a normal week. The break did not come on unusually high volume.
After the break, price came up to the area twice and closed under 12.41 both times
In the week of 21 September the high was 12.87 and the week closed at 12.31, inside the area. In the week of 28 September the high was 12.53 and the week closed at 12.18. A touch after a break is called a retest. The area has eight touches before the break and two after.
The week of 5 October closed at 11.06. The next weeks closed at 11.05, 10.79 and 11.26. The highest high in those four weeks is 11.66, in the week of 26 October, under 12.29.
Over the price: 12.35 is the nearest of three lines that held
The weekly chart shows 20 lines over the price and trusts 3 of them: 12.35, 18.06 and 18.45. It does not trust the other 17. Of those, 15 have been crossed 3 times or more.
The monthly chart shows 26 lines over the monthly close of 11.26. It trusts none of them.
Under the price: the weekly chart has support at 9.74, the monthly chart at 6.33
The weekly chart shows 3 lines under the price and trusts 1: 9.74, which is 13.5% under the weekly close of 11.26. The other two are 10.92 and 10.53. It trusts neither.
The monthly chart shows 10 lines under the monthly close of 11.26 and trusts 1: 6.33, which is 43.8% under. The two charts name different prices, and each is measured on its own chart. Neither has support near 11.26.
The weekly chart shows 23 lines in all and does not trust 19 of them. Of those 19, 16 have been crossed 3 times or more, 2 are clues and 1 has switched sides. The monthly chart does not trust 35 of 36 lines. Of those 35, 30 have been crossed 3 times or more and 5 are clues.
One price axis. Two charts. Each chart is measured on its own.
Eight weeks reached the area before the break and two after.
One weekly close that would change this read
A weekly close over 12.41, the top of the area. Price would then be back over the area, and the break on 14 September would not have led to resistance.
It shows on the weekly chart at the end of a week.
Why this post gives no forecast
1,350 breaks have been measured across the site's companies. The 12 weeks after a break look like any 12 random weeks, whether the level held or not. The measurement gives no basis for a forecast. The post also does not say what made price fall.