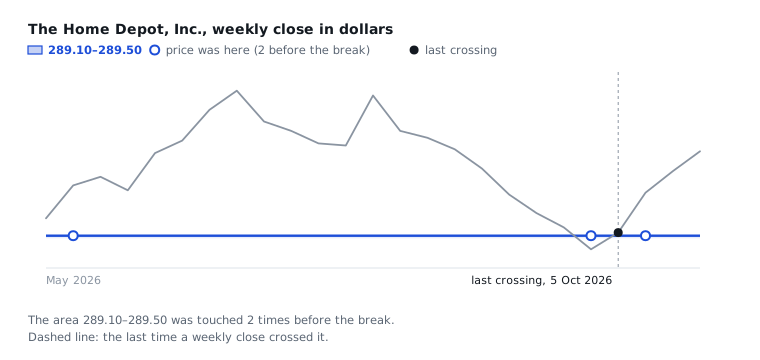
Home Depot stock: 289.30 was broken upward in the week of 5 October, and the retest week closed at 309.63
The nearest support is 289.30, 12.1% under the price. The nearest resistance is 426.47, 29.5% over.
Every figure below was measured on November 2, 2026 and has not been updated since.
The Home Depot sells home improvement products, building materials, garden supplies and home decor, in its stores and online. It also installs products for customers and rents out tools and equipment. At the end of fiscal 2025 it ran 2,359 stores in the U.S., Canada and Mexico. Its customers are homeowners who do their own projects, homeowners who hire someone else, and professionals such as contractors, builders and tradespeople. Its SRS business supplies roofing, landscaping, pool and drywall products to professionals from over 1,250 locations.
Home Depot closed the week of 26 October at $329.20. In the 20 weeks from 18 May to 28 September, 19 weekly closes were over 289.30 and 1 was under it. Did 289.30 work as support again?
Support is a price where buyers came before and stopped a fall. Resistance is a price where sellers came before and stopped a rise.
The answer is that the week of 28 September closed under 289.30, at 282.85, and the week of 5 October closed over it, at 290.74. In the week of 12 October price went down to 288.51 and closed at 309.63. That is one retest. One retest is a short record.
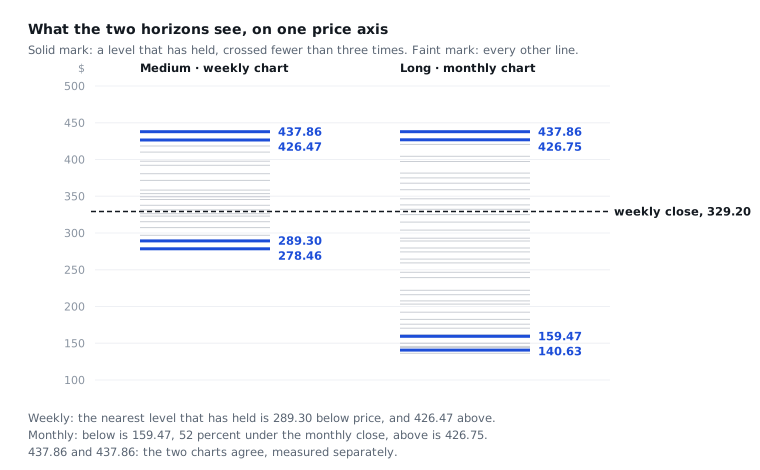
Nearest support that held: 289.30 dollars on the weekly chart, 12.1% under the weekly close. The monthly chart has support at 159.47, 51.6% under the monthly close.
Nearest resistance that held: 426.47 dollars on the weekly chart, 29.5% over the weekly close. The monthly chart has resistance at 426.75, 29.6% over the monthly close.
Every price is a weekly close in dollars, unless the text says "monthly", "low", "high" or "open".
Business numbers: revenue grew 2.5% in the last 12 months, against 14.4% in 2022
These numbers come from Home Depot's 10-Q filed 25 August 2026. The newest 10-K in the data was filed 18 March 2026.
2022
2023
2024
2025
2026
Last 12 mo
Revenue growth
14.4%
4.1%
−3.0%
4.5%
3.2%
2.5%
Operating margin
15.2%
15.3%
14.2%
13.5%
12.7%
12.4%
Free cash flow margin
9.3%
7.3%
11.8%
10.2%
7.7%
8.9%
Return on capital
58.1%
53.1%
44.6%
36.4%
27.6%
27.3%
For each 1 dollar of revenue, the company costs $2.22 today, on the price date 30 October 2026. In the last 12 quarters the low was $2.03, the middle $2.54 and the high $2.89. That is near its 3-year low (1 of 12 quarters were lower).
The price asks for +7.7% a year. That is free cash flow growth over the next 10 years that makes today's price fit for an investor who wants a 8.9% return a year. Method: reverse DCF (discounted cash flow), from the price and the filings.
Set next to it, from the filings: revenue grew +1.5% a year over the last 3 years and +2.5% in the last year. Cash flow over the last 5 years changed by 1.7% a year. The analyst figure is not determined: no analyst data was fetched.
These numbers and the chart below are two separate measurements. They share one number, the price. The business numbers use the price of 30 October 2026. The chart uses weekly closes. The numbers do not say whether the price is right.
289.30 was support for 19 weekly closes, one weekly close went under it, and the close came back over
Price reached the level in two weeks before the weekly close back over it and in one week after.
Price first reached 289.30 in the week of 18 May. In the 20 weeks from then to the week of 28 September, 19 weekly closes were over the level and 1 was under it.
The close under the level came in the week of 28 September: 282.85. Before it, the week of 21 September closed at 293.20. The data does not say why.
In the week of 5 October price opened at 283.54, went down to 279.76 and closed at 290.74, over the level. Volume was 28,416,900 shares, which is 1.37 times a normal week.
The week of 12 October is the retest. Price went down to 288.51, under the bottom of the level at 289.10, and closed at 309.63. The week of 19 October closed at 319.83 and the week of 26 October at 329.20. A touch after a break is called a retest. There has been one.
Over the price: 426.47 is the nearest resistance that held
The weekly chart shows 14 lines over the price and trusts 2 of them: 426.47, which is 29.5% over the weekly close, and 437.86.
The monthly chart shows 12 lines over the monthly close of 329.20 and trusts 2 of them: 426.75, which is 29.6% over, and 437.86. The two charts agree on 437.86. They are close on the other level, 426.47 and 426.75.
Under the price: 289.30 is 12.1% under, and the monthly chart has no level near it
One price axis. Two charts. Each chart is measured on its own.
The weekly chart shows 7 lines under the price and trusts 2 of them: 289.30 and 278.46. The nearest, 289.30, is 12.1% under the weekly close of 329.20. The level spans 289.10 to 289.50.
The monthly chart shows 26 lines under the price and trusts 2 of them: 159.47 and 140.63. The nearest, 159.47, is 51.6% under the monthly close. The monthly chart has a line at 289.10, but it has been crossed 11 times, and the monthly chart does not trust it.
The weekly chart shows 21 lines in all and does not trust 17 of them. Of those 17, 16 have been crossed 3 times or more and 1 has switched sides. The monthly chart does not trust 34 of 38 lines. Of those 34, 26 have been crossed 3 times or more and 8 are clues. The monthly chart is measured to October 2026.
One weekly close that would change this read
A weekly close under 289.10. That is the bottom of the level, and price would then be under it again. The return over 289.30 on 5 October would not have led to support.
It shows on the weekly chart at the end of a week.
Why this post gives no forecast
1,350 breaks have been measured across the site's companies. The 12 weeks after a break look like any 12 random weeks, whether the level held or not. The measurement gives no basis for a forecast.