Berkshire Hathaway stock: 539.90 dollars was broken upward, and price has been back to the level once
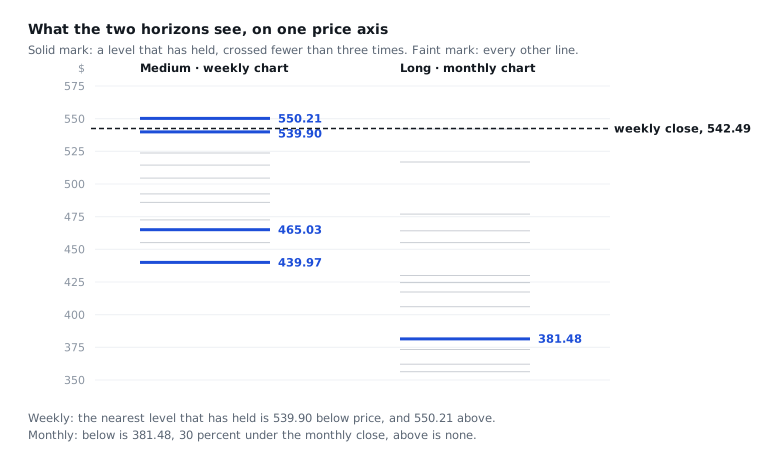
The nearest support is 539.90, 0.5% under the price. The nearest resistance is 550.21, 1.4% over.
Every figure below was measured on November 2, 2026 and has not been updated since.
Berkshire Hathaway (class B) closed the week of 26 October at 542.49 dollars. In the week of 19 October the close went over 539.90. Has 539.90 acted as support since then?
Support is a price where buyers came before and stopped a fall. Resistance is a price where sellers came before and stopped a rise.
The answer is that price has gone down to the level once since the break, and that week closed over it. The record is two weeks long, which is short.
Nearest support that held: 539.90 dollars on the weekly chart, 0.5% under the weekly close. The monthly chart has support at 381.48, 29.7% under the monthly close.
Nearest resistance that held: 550.21 on the weekly chart, 1.4% over the weekly close. The monthly chart has none.
Every price is a weekly close, unless the text says "monthly".
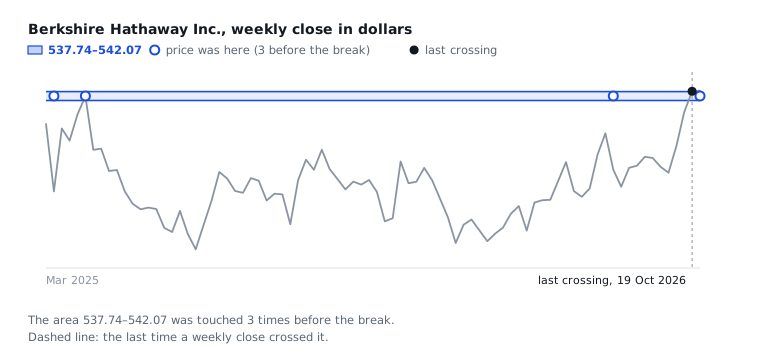
539.90 was reached in three weeks over 81 weeks and was broken in the week of 19 October
Price reached the level in three weeks before the break and in one week after.
The level is a band from 537.74 to 542.07. The weeks of 31 March 2025, 28 April 2025 and 10 August 2026 reached it. The first of those is 81 weeks before the break. In 80 weeks before the break the close was under the band. No close was over it.
In the week of 19 October, Berkshire closed at 542.19, over the band. Volume was 25,216,200 shares, which is 1.1 times the average of the last 52 weeks. That is a normal week, not a large one.
The week of 26 October went down to 539.23, inside the band, and closed at 542.49. A touch after a break is called a retest. The level has three touches before the break and one after.
One retest is a thin record. Both weeks since the break closed over 542.07, the top of the band.
Over the price: the weekly chart has one level that held, 550.21
The weekly chart shows 1 line over the price: 550.21. It trusts it. It is 1.4% over the weekly close of 542.49. The highs of the last two weeks were 549.96 and 550.47.
The monthly chart shows no line over the monthly close of 542.49.
Under the price: the weekly chart trusts 539.90 and the monthly chart trusts nothing near it
One price axis. Two charts. Each chart is measured on its own.
The weekly chart shows 10 lines under the price and trusts 3 of them. The nearest is 539.90, which is 0.5% under the weekly close. The next two are 465.03 and 439.97.
The monthly chart shows 34 lines under the monthly close of 542.49 and trusts 3 of them. The nearest is 381.48, which is 29.7% under. The next two are 174.41 and 160.21. The monthly chart has a line at 542.07, but it is a clue and not a level, so it does not trust it.
The two charts do not name the same price near the close. The weekly chart has 539.90 and the monthly chart has 381.48. Each is measured on its own chart.
The weekly chart shows 11 lines in all and does not trust 7 of them. All 7 have been crossed 3 times or more. The monthly chart does not trust 31 of 34 lines. Of those 31, 24 have been crossed 3 times or more and 7 are clues. The monthly chart is measured to October 2026, the last finished month.
One weekly close that would change this read
A weekly close under 539.23, the low of the week of 26 October. Price would then be back under the level it went down to, and the break in the week of 19 October would not have led to support.
It shows on the weekly chart at the end of a week.
Why this post gives no forecast
1,350 breaks have been measured across the site's companies. The 12 weeks after a break look like any 12 random weeks, whether the level held or not. The measurement gives no basis for a forecast.
The post cannot say how Berkshire's price moves from here. Two weeks since the break is too short to compare with anything.
Analysis, not investment advice. Everything here reports what was measured. What to do about it is your decision.